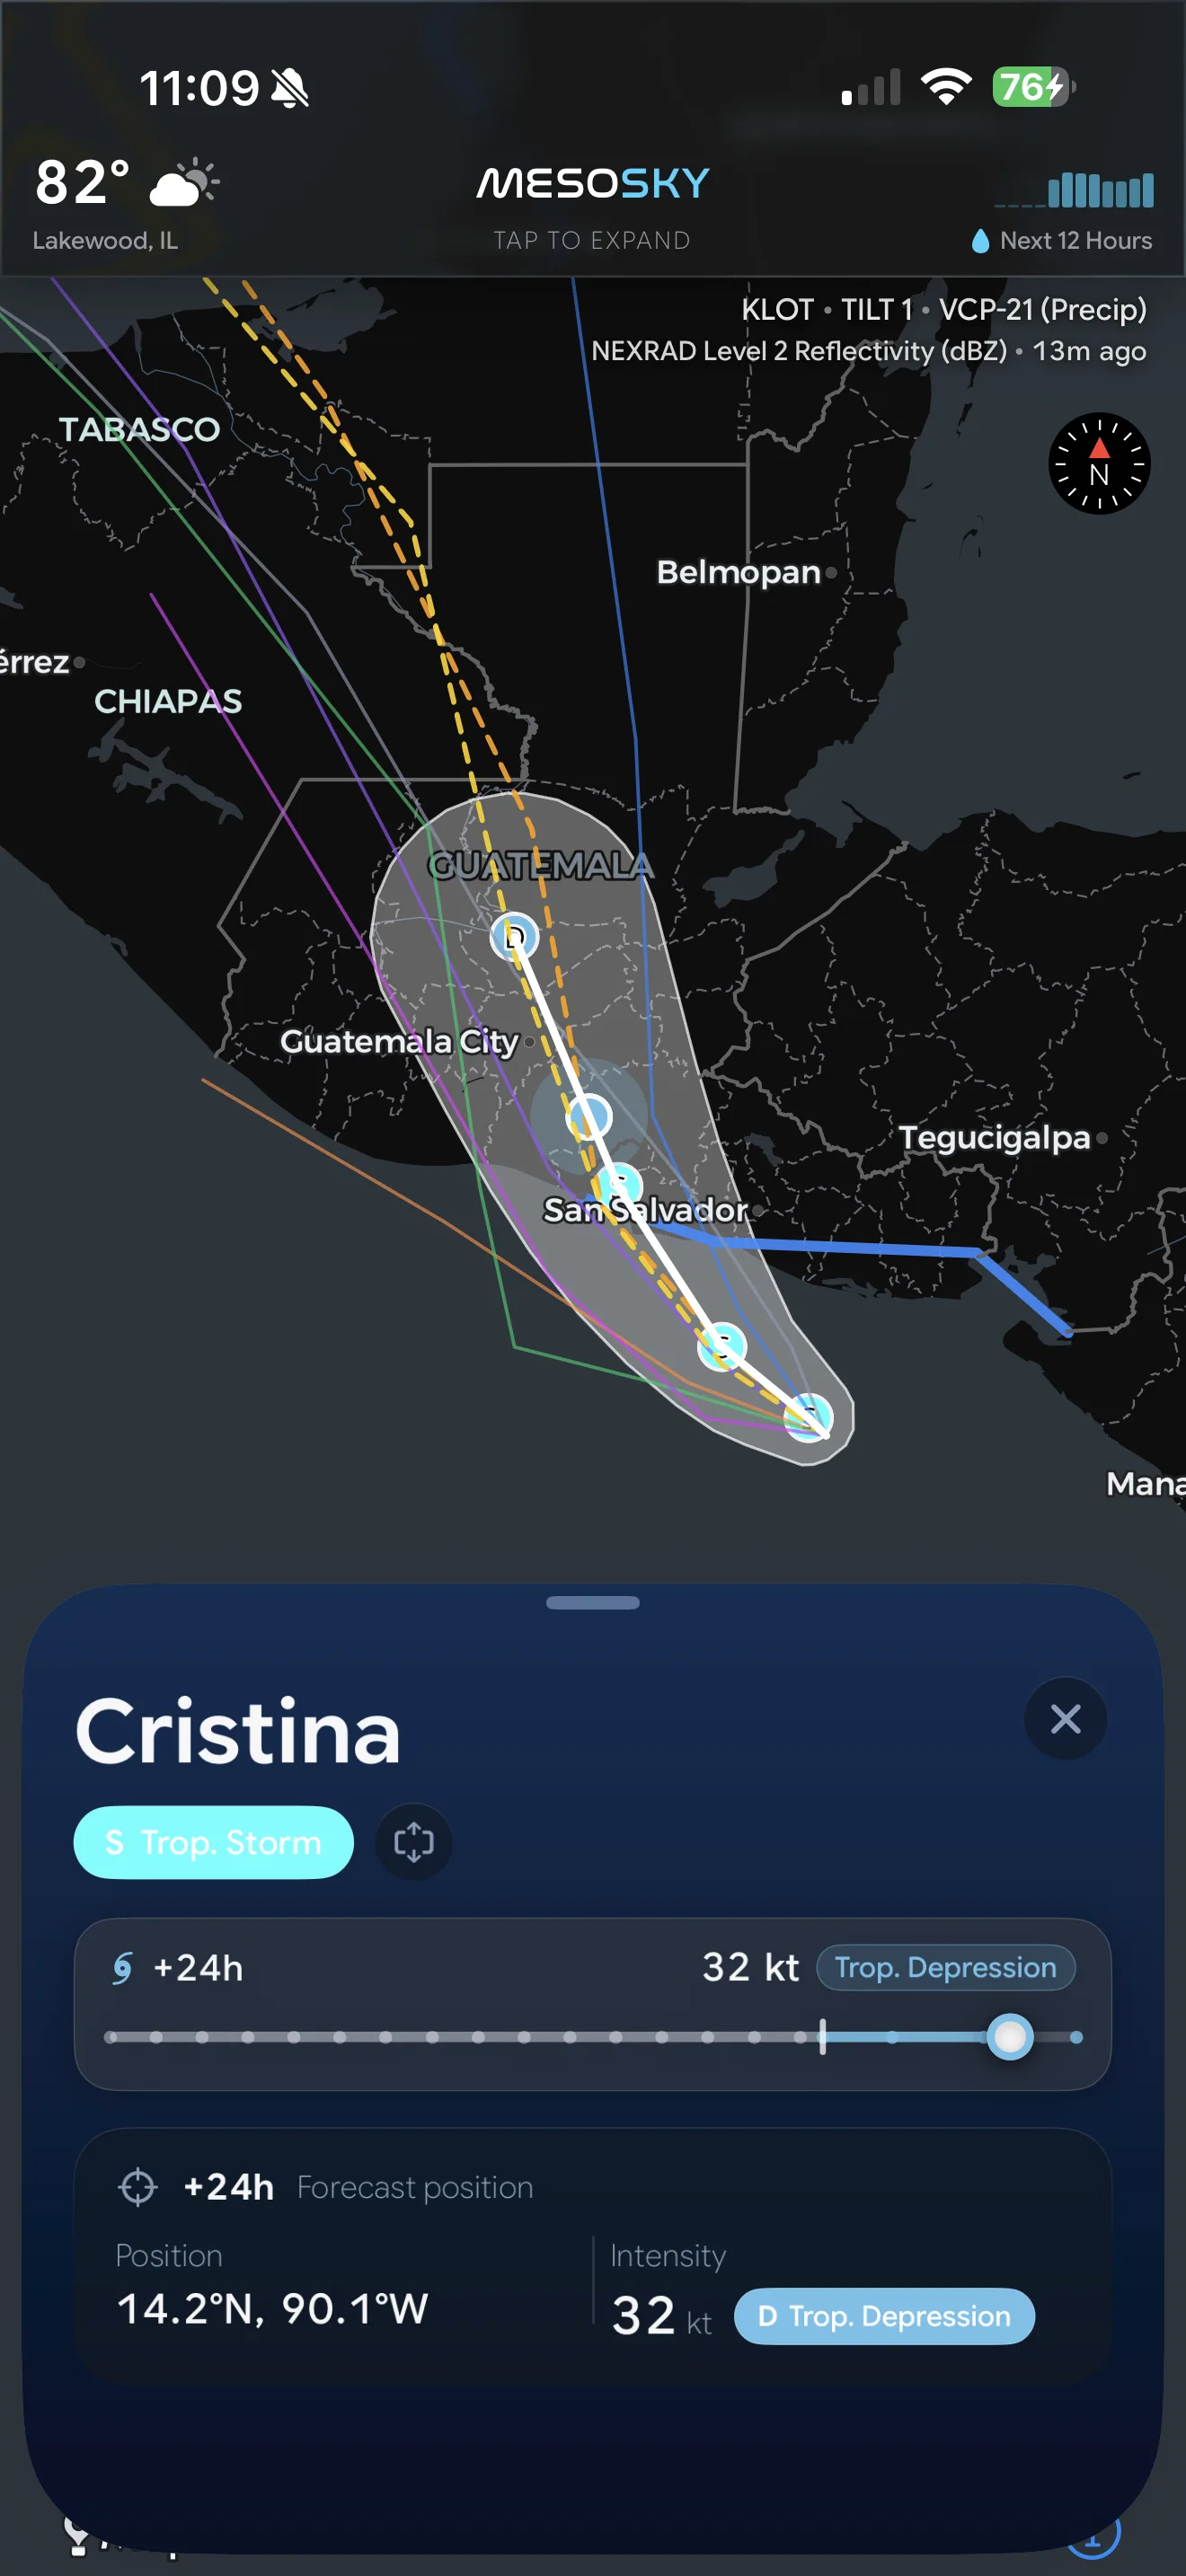
The map shows the cone of uncertainty, the official forecast track with day-by-day intensity fixes, watch & warning lines, and category-coded storm markers — straight from NHC.
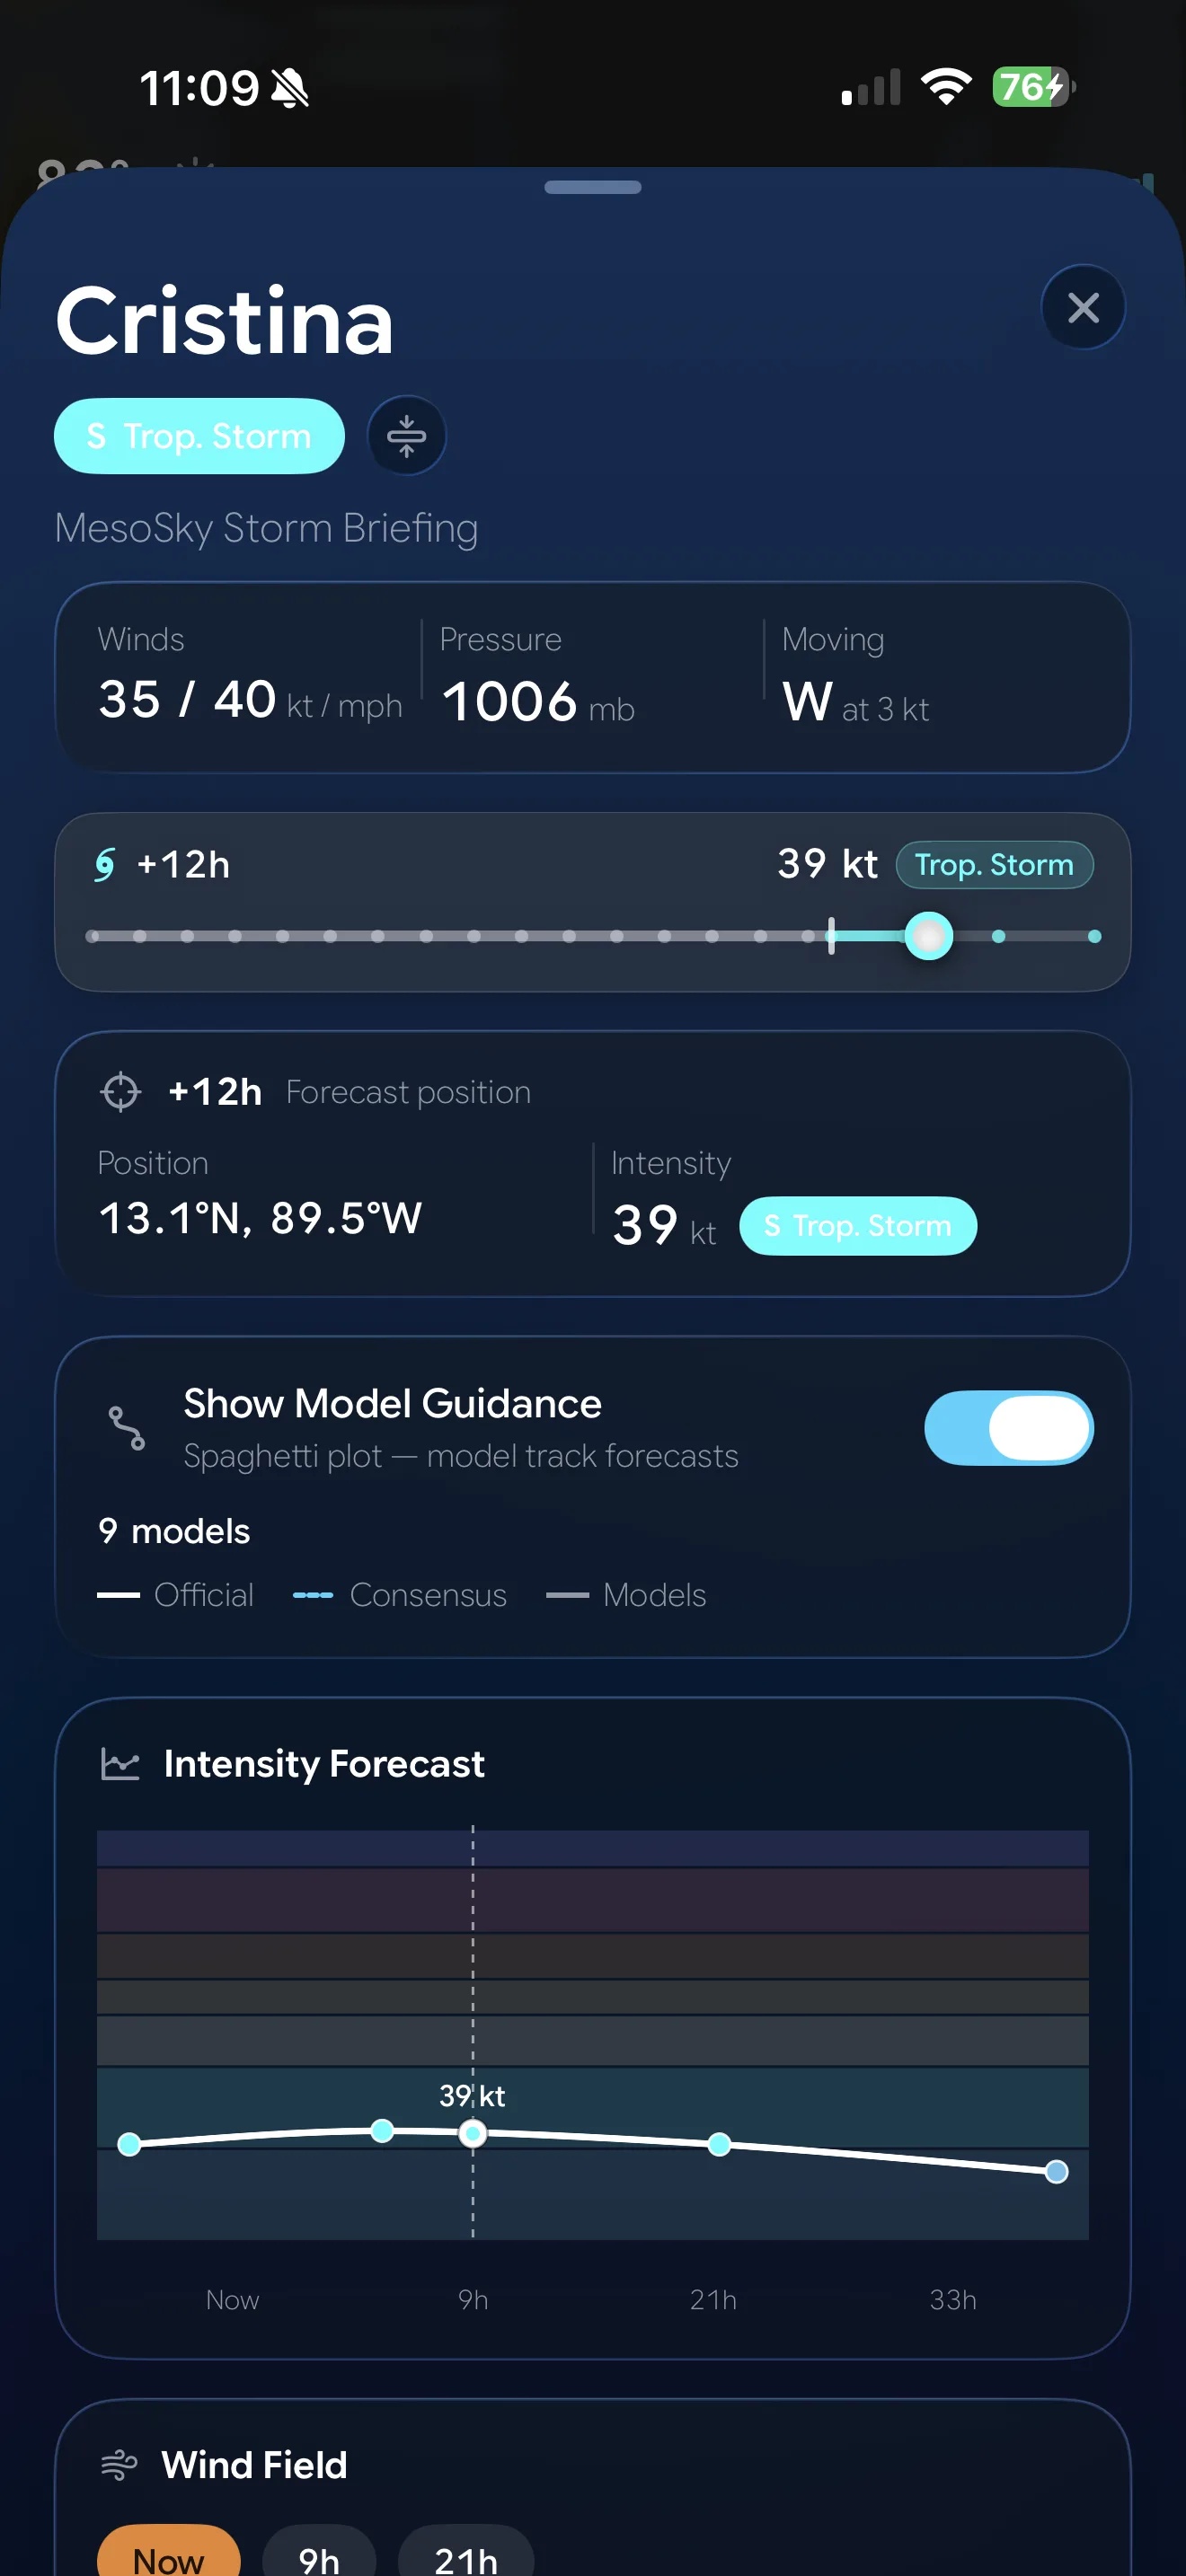
Tap a storm and the Storm sheet opens: the full advisory, an intensity curve across the five-day forecast, and wind-radii quadrants showing how far 34/50/64-knot winds reach. Scrub the timeline from the storm's recorded history through +120 hours — the map follows every fix.
Then turn on Model Guidance: spaghetti tracks from ten-plus forecast models — GFS, ECMWF, HWRF and friends — with the official forecast emphasized so you can see the consensus and the outliers at a glance.